For years, to debug shader code, you had to rely almost entirely on the final output. To inspect a variable in the middle of a shader, you would comment out everything after it and assign the value to the output COLOR built-in.
For example, let's take this shader that draws a blue circle:
Shader preview breakpoints started as an add-on I made to make shader programming easier, with the help of the community. It was then ported to the engine and improved by Chaosus and vaner-org. Thanks, guys! That was a great collaboration.
If you use Godot to code shaders, this feature will save you a lot of repetitive steps!
OldDew
Teacher at GDQuest
Get the shader to follow along
I will use the portal shader you learn to create in our free intro to shaders course. This is what it looks like:
Portal Shader
To try the shader preview breakpoints with me, copy the shader code below and apply it to a Sprite2DSprite2D node in any Godot project:
Code Reference: res://portal.gdshader
This is the complete shader code after adding gradients to the rim and the center shape.
To insert a shader preview breakpoint, move your mouse cursor to the Shader Editor's left gutter, next to a fragment shader line you want to preview. An GuiVisibilityVisibleeye icon will appear.
Click the icon to preview what the fragment shader produces up to that point in your code.
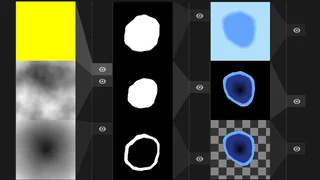
The image next to each preview breakpoint shows the result of applying the variable on that line to the COLOR built-in.
How does this work under the hood?
Since the COLOR built-in has the vec4 type, smaller variable types are placed from left to right inside a vec4 before being assigned.
If you preview a variable called my_var, it will show different values based on its type:
If it's a floatfloat, COLOR will be vec4(my_var, 0.0, 0.0, 1.0)
If it's a vec2, COLOR will be vec4(my_var, 0.0, 1.0)
If it's a vec3, COLOR will be vec4(my_var, 1.0)
If it's a vec4, COLOR will be my_var
This is why, in the video above, when we preview the center variable, we get a yellow color:
vec2 center =vec2(0.5,0.5);
Previewing the center returns yellow
Behind the scenes, the editor runs a shader that looks like this:
voidfragment(){vec2 center =vec2(0.5,0.5);
COLOR =vec4(center,0.0,1.0);}
Using multiple breakpoints
You can use as many preview breakpoints as you like. This makes it easy to inspect effects that need many steps to build. For example, the shader creates a mask for the portal's rim by subtracting two circles of different sizes. This is done in three steps:
Create the outer circle mask
Create the inner circle mask
Subtract the two masks to get a ring
Create a breakpoint next to each step to reveal the full sequence leading to the ring mask. This makes it much easier to see where an unexpected value comes from.
Preview breakpoints can be computationally expensive!
Godot runs a new shader for each breakpoint. Too many breakpoints might slow down your editor, especially in the case of 3D shaders.
You can use as many breakpoints as you like, but you should be mindful of how many are open and close the ones you no longer need.
Previewing shader changes
Each preview window updates automatically as you change the shader code. Try changing the value of the center variable and see how it affects the shader result and preview breakpoints:
Why does changing the center affect the mask previews?
You might expect a breakpoint to only show the value of the variable at that line. That's not the case!
Think about how breakpoints work when you debug GDScript code: All the code that comes before the breakpoint runs. When the breakpoint is reached, the execution stops.
It's similar with shaders. When you preview the line defining the mask_outer variable, the preview window is rendered using the shader code up until that point.
This is why changing center also changes the mask_outer preview. The preview still has to calculate everything that mask_outer depends on, including distance_from_center, which depends on center.
Cleaning up preview breakpoints
There are two ways to remove a preview breakpoint:
Click the GuiVisibilityVisibleeye icon in the editor's gutter.
Hover the preview image. This reveals the CloseClose button and the breakpoint's line number. Click the CloseClose button to remove the breakpoint.
To navigate to the line of code that the breakpoint is on, click the line number that appears when you hover over the preview image.
Previewing uniform changes
Uniforms let you edit an effect's properties directly from the Inspector dock, and preview breakpoints can reflect those changes. However, unlike shader code edits, in Godot 4.7, Inspector updates do not automatically refresh preview breakpoints. For now, you need to refresh manually.
In the Inspector, navigate to ShaderMaterialShader Parameters and change the Radius property. Look at the bottom-left of the shader editor and click the RotateLeftUpdate button to synchronize the breakpoint previews with the Inspector changes.
When the feature was added to Godot, there was no way to detect changes to shader parameters through the Inspector and the solution to still get the feature in Godot 4.7 was to update the previews manually in that case.
The preview breakpoints do not work in every situation. They are limited in these cases:
They only work inside fragment shaders.
They cannot preview the TEXTURE built-in.
They do not work inside loops.
Breakpoints only work inside fragment shaders
If you try to add breakpoints outside of the fragment shader, instead of a preview, Godot will show an error message. It cannot preview because there is no data to calculate the output of the function:
You use the TEXTURE built-in to sample the main texture of a 2D node such as a Sprite2DSprite2D.
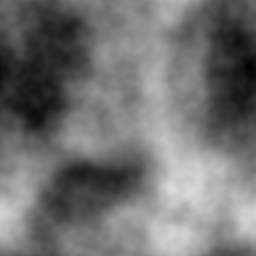
Breakpoints do not support this built-in. For example, adding a breakpoint to the sampled_texture variable below shows a white square instead of the actual texture:
We get a white square instead of the actual texture!
Workaround: Create a new sampler2D uniform and use that for sampling the texture instead of the TEXTURE built-in. In this clip, I move the noise texture to a new uniform:
Why did you add repeat_enable to the sampler2D uniform?
Sprite2DSprite2D nodes define how their texture repeats through the TextureRepeat property. The portal's noise texture has Repeat set to Enabled. This allows the animation offsetting the texture to run indefinitely.
sampler2D uniforms are not controlled by the parent sprite. They are created inside the shader, which means you need to manually tell Godot that the texture will repeat with the repeat_enable hint. You can check out all editor hints in the official documentation.
Breakpoints do not work inside loops
Setting breakpoints inside while, for, and do...while loops will also cause an error. This prevents you from inspecting individual loop iterations.
Workaround: If you used the loop to update a variable, you can preview its final value by assigning it to itself immediately after the loop completes and placing a breakpoint on that line.