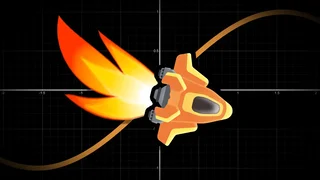
Wavy water, wispy ghosts, and even fire bending animations all have something in common: they're built using mathematical functions that generate their shape, color and animations.
Wavy Water shader
Wispy Ghost ShaderPilot watching their back!
In most shaders you'll encounter, these functions and their parameters can feel arbitrary and random. In reality, shader artists don't rely on guesswork to achieve the look they envision. They follow simple techniques to visually control and adjust functions to fit their needs.
In this guide, you'll discover how to work with shader functions visually and intentionally. You'll be able to control their movement, scale and shape in order to achieve the effects you want.
You'll learn:
Function use cases in shaders
How to visualize functions
Techniques used for translating and scaling functions
Your first function
A function defines the relationship between two values. One of the simplest functions is the identity function, when the two values are equal:
In Maths class, you may have seen this written as . In other words, when is equal to 1, is also 1. When it is equal to 2, is 2, and so on. When grows, grows as well, with the same rate.
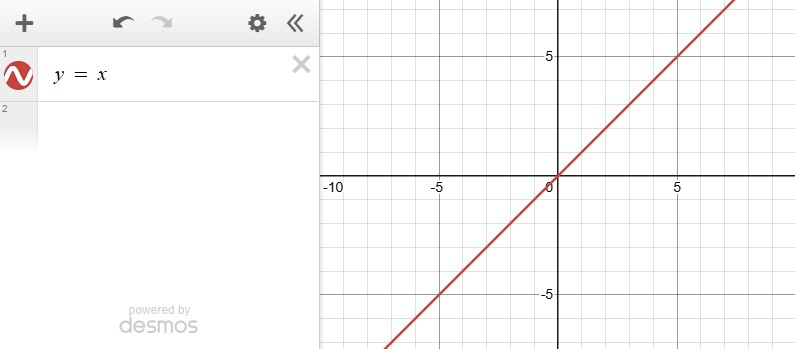
On a 2D graph, we can represent by a horizontal axis and by a vertical axis. If we execute the function for each value of , we obtain a diagonal line.
There are many tools that allow you to do this. One such tool is Desmos:
The Desmos Graphing Calculator is a free online tool that lets you visualize mathematical functions and equations as graphs.
You can use it directly in your browser to:
draw graphs of functions
move sliders to change parameters in real time
animate functions over time
You can try the functions shown in this guide at https://www.desmos.com/calculator. Add a function equation to the left side panel to see its graph. To make it interactive, write the name of a function parameter on a different row to get a slider for that value.
Careful! In Desmos, like in your Maths classes, you're probably used to y going up. is higher than .
In Godot, the convention is that goes down. So is lower than .
Just something to keep in mind when using Desmos or Godot.
OldDew
Teacher at GDQuest
Function usage in Godot shaders
In 2D shaders, UV coordinates are one of the most common values to work with.
The UV is a vec2 built-in variable that holds a pair of values (x, y) which range between [0.0, 1.0]. They represent the position of the current pixel.
Let's draw a blue canvas and discard all pixels for which .
shader_type canvas_item;voidfragment(){if(UV.y > UV.x){discard;}
COLOR =vec4(0.1,0.3,0.55,1.0);}
The line COLOR = vec4(...) sets the color of the pixel to blue. While discard makes the pixel transparent.
Remember: shaders run for every pixel individually. So let's imagine the shader receives a pixel with UV coordinates (1.0, 0.0). That's the top right corner. Because is greater than , the pixel is blue.
Now let's imagine the shader receives a pixel with UV coordinates (0.0, 1.0). That's the bottom left corner. Because this time, is greater than , the pixel is discarded.
How do I write shaders in Godot?
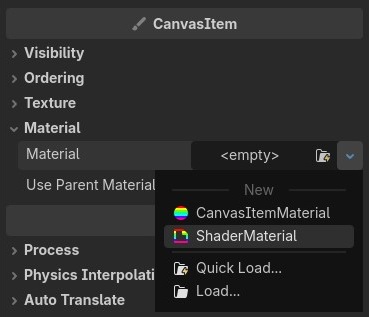
You can assign a shader to a CanvasItem's Material. The material property is found under Inspector > CanvasItem > Material.
To create one, click on the dropdown and select ShaderMaterial.
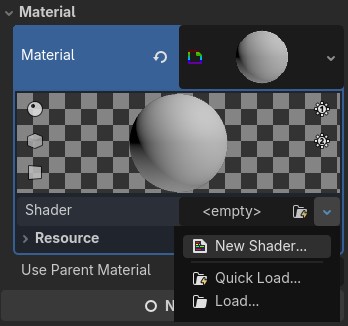
Next, click the shader dropdown to assign a 'New Shader...' to the material.
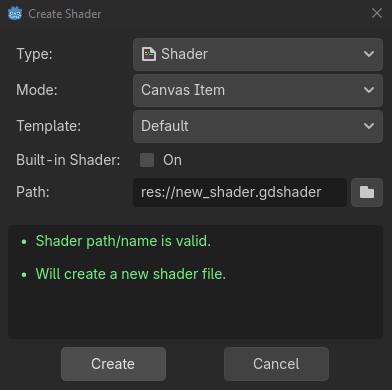
The shaders in this guide will be text-based and 2D. For that, set the type to 'Shader', the mode to 'Canvas Item' and click Create.
Why 'y > x' instead of 'y = x'?
A mathematical line has no thickness. Fragment shaders evaluate conditions for fragments on a discrete grid.
Because of this, a condition like y == x almost never matches enough fragments to be visible.
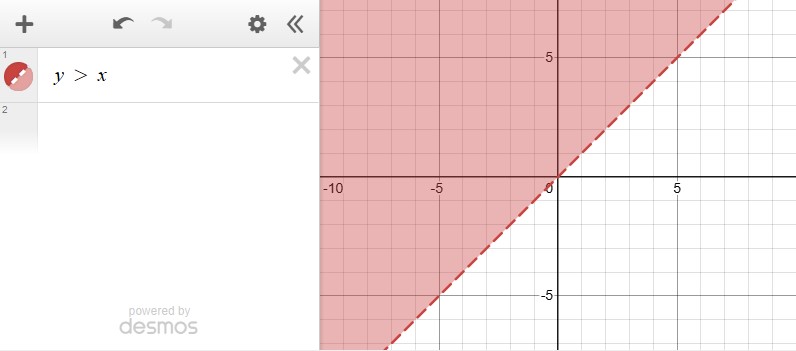
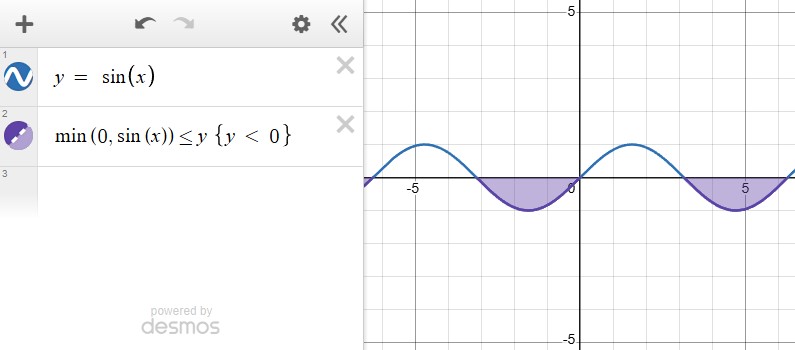
If, instead, you discard everything above, the function shape stays clear. You can also do the same in Desmos:
The last instruction inside the fragment shader sets the COLOR to blue, so this is a fair assumption.
However, discard is a definitive operation. It immediately stops processing of the current fragment. The pixel is never drawn, even if you assign a color later.
Godot and many other applications represent a lack of color and transparency with a checkered texture. Our shader previewer does the same!
UVs Recap
UVs are among the most important tools used by a shader artist.
If you'd like a more detailed recap of UVs check out and bookmark this free library entry: Shader UVs
There's a noticeable difference between the Desmos graph and the shader result because of goes up in Desmos, but down in Godot.
Flip the axis to see the same function in Godot:
voidfragment(){vec2 uv =vec2(UV.x,1.0- UV.y);if(uv.y > uv.x){discard;}
COLOR =vec4(0.1,0.3,0.55,1.0);}
With this setup, you can try out any mathematical function.
How does flipping the y axis work?
Remember, the UV.y value goes from 0 to 1. In Godot, 0.0 is the highest value (at the top) and 1.0 is the lowest possible value (at the bottom).
So let's say a point was very close to the bottom, at 0.9. If we calculate 1.0 - 0.9, we get 0.1. This puts the point at the top.
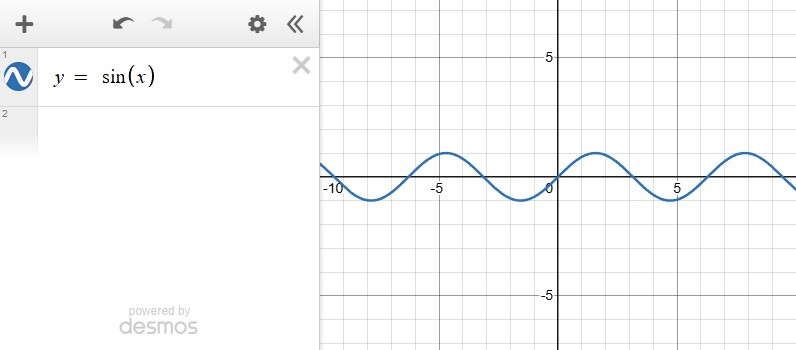
Let's turn the blue shader into water. You can add a wave with the function. Here's what it looks like in Desmos:
You can do the same thing in Godot with this shader:
voidfragment(){vec2 uv =vec2(UV.x,1.- UV.y);if(uv.y >sin(uv.x)){discard;}
COLOR =vec4(0.1,0.3,0.55,1.0);}
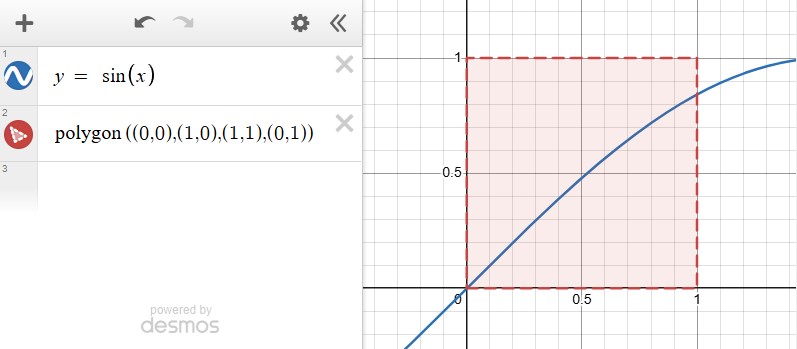
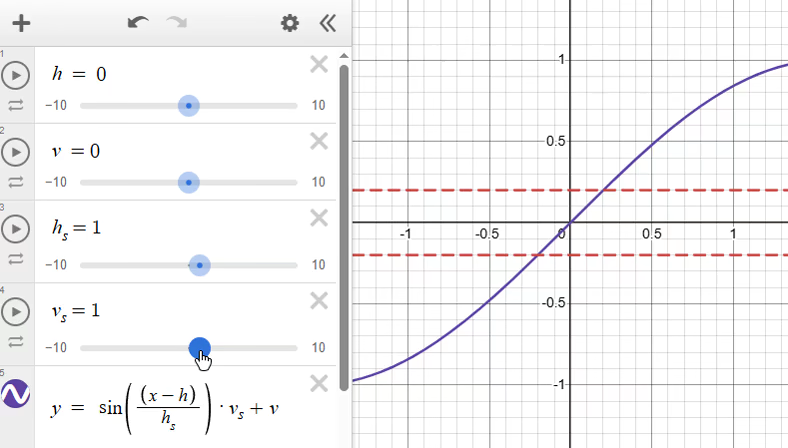
There seems to be no oscillation. But the shader is correct. The reason you don't see it is that UVs only cover a small part of the sine wave, the [0.0, 1.0] interval. If you zoom in to that region in Desmos, the function looks identical to the graph you see in Godot:
Desmos draws polygons with the polygon() operator.
Pass in the points making up the polygon. For a square that goes from 0 to 1, write polygon((0,0),(1,0),(1,1),(0,1)).
For a water effect that fits this range, you'll want to shrink down and reposition the sine wave. When it comes to moving and scaling a function, there's a one size fits all technique you can use.
Let's jump in and see how it works!
Function transformations
Translation
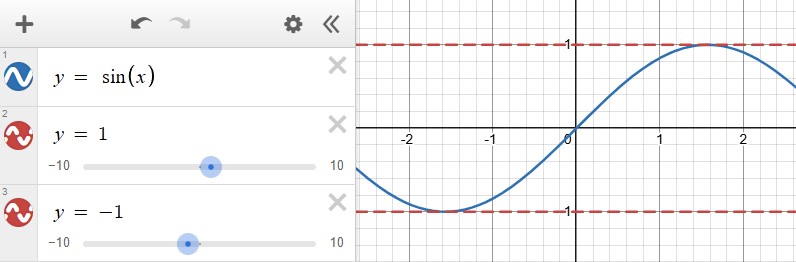
Let's look again at the sine function: . Here, x represents the horizontal coordinate and y represents the vertical one.
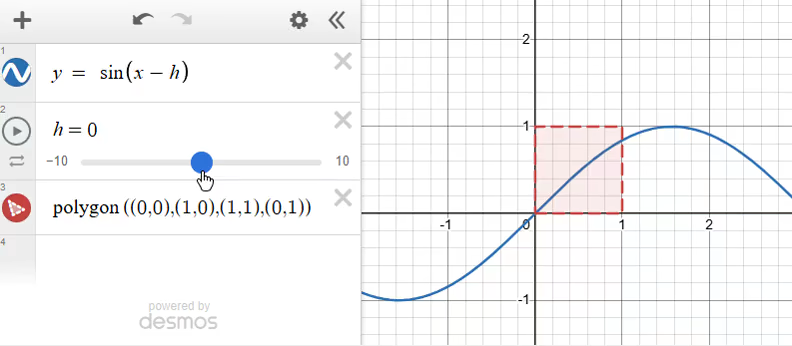
If you subtract a value from x, the function moves horizontally.
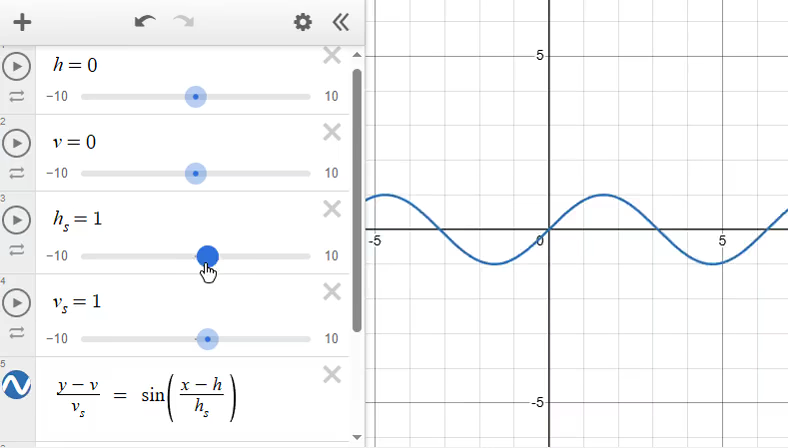
You can turn that value into a variable h (for horizontal movement) and the function becomes:
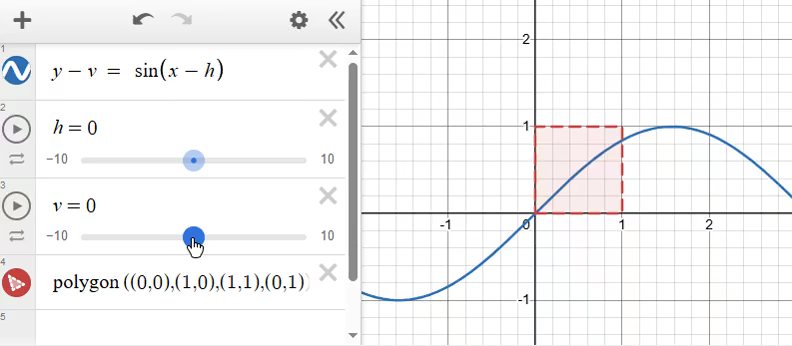
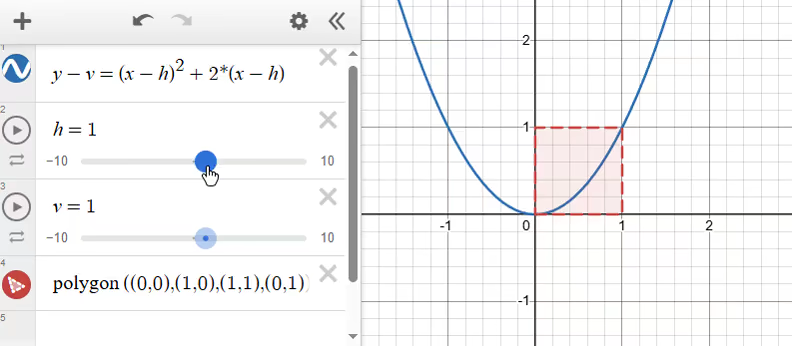
This technique works for any function, even one with multiple instances of or . As long as you identify and subtract the corresponding variables from them, you'll be able to move those functions just like you did with the sine.
Let's take the more complex function . This creates a parabola (you don't need to understand the formula, it's just an example). To shift it vertically or horizontally, you can transform this function into:
To do the same in Godot, define two uniforms, one for h and one for v and use them in the comparison.
H
V
shader_type canvas_item;uniformfloat h :hint_range(-3.14,3.14)=0.0;uniformfloat v :hint_range(-3.14,3.14)=0.0;voidfragment(){vec2 uv =vec2(UV.x,1.- UV.y);if(uv.y - v >sin(uv.x - h)){discard;}
COLOR =vec4(0.1,0.3,0.55,1.0);}
Uniforms
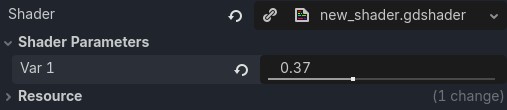
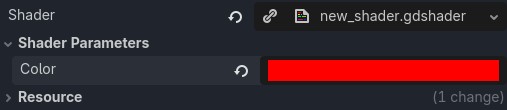
Uniforms act like the variables you set in Desmos. They expose shader properties to the Godot Inspector. Define them in the global scope, outside any function:
uniformvec2 direction =vec2(0.0,0.0);
Some types accept editor hints that control how the property appears in the inspector. A hint_range on a float produces a slider:
uniformfloat var1 :hint_range(0.0,1.0)=0.0;
source_color on a vec4 produces a color picker:
uniformvec4 color : source_color =vec4(1.0,0.0,0.0,1.0);
Why are slider labels capitalized?
When you export a uniform in Godot, it strips underscores and capitalizes every separated word in order to show a pretty label to the developer.
For example: uniform float wave_count reads as Wave Count in the Inspector.
Why use a graphing tool when I could directly use uniforms?
Working in a specialized tool eliminates shader constraints like the [0.0, 1.0] range. This makes it easier to focus on designing functions instead of implementation details.
Most tools also let you:
visualize multiple functions at once
restrict or highlight domains (for example, showing a function when x is in the [0.0, 5.0] range)
export and share interactive graphs
Scaling
You know how to move functions, but that still doesn't solve the main issue: no matter how much we shift the wave left and right, up and down, the sine can't fit inside the [0.0, 1.0] range.
That can be solved by scaling the function.
If you divide x or y by a value, the function scales in that direction.
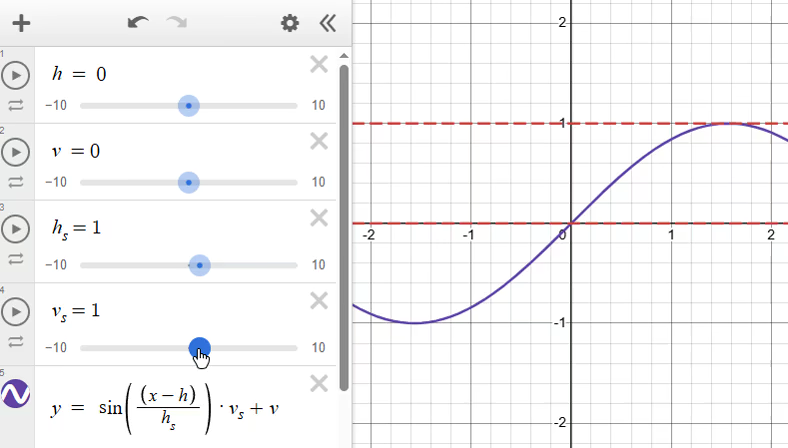
Let's divide by (horizontal scale) and by (vertical scale). The general formula for a movable and scalable function becomes:
This function is too big!
If you're not used to math notation, this can feel a little intimidating. But no worries, take your time and look at each term separately, it'll start to make sense.
We started with the terms:
: horizontal position.
: vertical position.
: a function (in our case, the sine function).
Then, we allowed for shifting each axis by introducing (horizontal offset) and (vertical offset):
And now, all we've done is divide each term by some new factor.
Update the shader with the new formula and you end up with a flexible and adjustable wave that can now be used to create the blue water effect.
H
V
H S
V S
shader_type canvas_item;uniformfloat h :hint_range(-3.14,3.14)=0.0;uniformfloat v :hint_range(-3.14,3.14)=0.7;uniformfloat h_s :hint_range(0.01,2)=0.2;uniformfloat v_s :hint_range(0.01,2)=0.1;voidfragment(){vec2 uv =vec2(UV.x,1.- UV.y);if((uv.y - v)/ v_s >sin((uv.x - h)/ h_s)){discard;}
COLOR =vec4(0.1,0.3,0.55,1.0);}
Isn't having 4 variables for a single function too much?
It can be. The goal of adding parameters is not to keep every variable in the final shader. They are tools for exploring the function and finding the values you want.
Once you have a function that fits your needs, simplify the shader by keeping only the parameters that are useful in practice.
The final parameters depend on how you plan to use the shader. For example, you might be happy with a water shader that has a fixed wave shape and vertical position. In that case, only the horizontal movement is controllable. The rest of the uniforms can be reduced to constants:
H
shader_type canvas_item;uniformfloat h :hint_range(-3.14,3.14)=0.0;voidfragment(){vec2 uv =vec2(UV.x,1.- UV.y);// 0.7, 0.1 and 0.2 are not random magic numbers.// They result from previous movement and scalingif((uv.y -0.7)/0.1>sin((uv.x - h)/0.2)){discard;}
COLOR =vec4(0.1,0.3,0.55,1.0);}
Why divide after subtracting?
The combined scaling and movement formula is .
Why not write it as ?
If you scale first, the translation values no longer match the size of the function. A small function needs smaller movement increments, while a large function needs larger ones.
And with this, you have the basic building blocks for controlling shader functions. To recap:
You can translate a function by subtracting from its variables.
Horizontal movement:
Vertical movement:
You can scale a function by dividing its variables.
Horizontal scale:
Vertical scale:
Combine these techniques to get a function that can be both positioned and resized:
Functions are everywhere
So far, you used functions just to discard fragments. But you can affect every aspect of a shader with them. After all, a function just transforms one value into another.
Let's make a ghost! First, you need to sample its texture. This first example of the shader does nothing special: it receives each pixel from the texture and displays it as-is.
voidfragment(){
COLOR =texture(TEXTURE, UV);}
Texture Sampling
You can use shaders to generate visuals from nothing. Procedural generation is powerful. It can produce visuals at infinite resolution using math alone.
Textures are limited in resolution and variation, but they let you directly paint or bake complex, detailed images by hand that would be impractical to describe procedurally.
Texture sampling bridges the two approaches. It lets shaders combine math with pre-made textures. The texture provides the initial pixel values, and the shader can then manipulate those values using math.
Godot provides a texture() function that takes two arguments:
a sampler2D, the texture being sampled
a vec2, the normalized coordinates from which to sample that texture
It returns a vec4 containing the RGBA color at those coordinates inside the texture.
You can plug in the TEXTURE and UV built-ins to get the default behavior for textured 2D nodes like Sprite2D and TextureRect: texture(TEXTURE, UV)
Ghosts are transparent. You can make the ghost less opaque by multiplying its COLOR alpha by a value smaller than 1.0.
voidfragment(){
COLOR =texture(TEXTURE, UV);
COLOR.a = COLOR.a *0.5;}
Control transparency with functions
This is the perfect moment to introduce a function! You can make the ghost change between visible and invisible over TIME with the sine function.
The TIME built-in returns the time since the engine has started, in seconds.
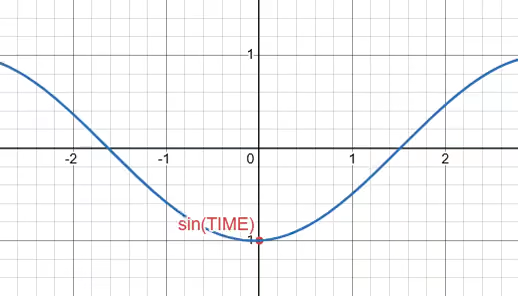
Since TIME is different in every frame, you can plug it in any mathematical function to create an animation. The sine function takes a number as input and produces a value that smoothly oscillates between and . As the input increases, the output repeatedly follows the same wave pattern. Feeding TIME into sin() means the input constantly increases, so the output naturally moves back and forth over time.
sin(TIME) is therefore just a value that continuously cycles between -1.0 and 1.0, making it perfect for animations like bobbing, pulsing or waving.
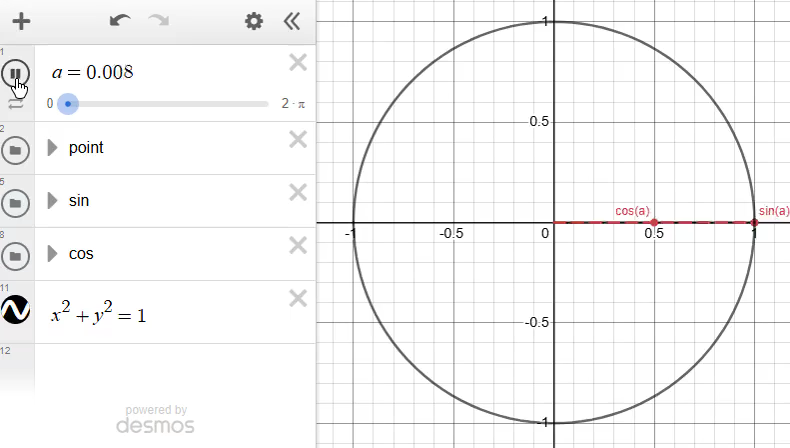
The sine function comes from circular motion. Imagine a point rotating around a circle at constant speed. If you track the point's vertical position, it repeatedly rises and falls in a smooth pattern. The computes exactly that vertical position. Similarly, the point's horizontal position is computed by the function.
Passing a value like TIME to either of the functions makes the point continuously rotate, causing the resulting value to oscillate.
Every time the pulse becomes a value smaller or equal to 0.0, the transparency value also gets smaller or equal to 0.0.
Negative alpha values cannot be represented. What would negative transparency even mean? Instead, the shader clamps transparency between [0.0, 1.0]. This explains why the ghost is invisible for so long: half of the time, the sine wave is under 0.0.
To address this, you need to change the scale and position of the sine function so that it oscillates between [0.0, 1.0].
Let's use the same parametrization technique:
Previously, you used this expression to compare two values, so keeping terms on both sides made sense.
Now, the goal is to produce a single pulse result that gets multiplied with the transparency.
Because of that, everything that's not the result () gets moved to the other side of the equation. The subtraction of and the division by both move to the right of the equal sign:
How did we move the terms on the left of the equation to the right?
Explaining equation resolution in full is beyond the scope of this article, but in short: inverting an operation means applying its opposite in reverse order.
Since was divided by after subtracting , solving for means multiplying by first, then adding .
The ghost could use a floating animation. You can create that by moving it up and down over TIME by some amount. Use the same formula to make an oscillating wave between [-0.2, 0.2].
I tried a different texture and I'm getting weird artifacts. Why?
The UV coordinates are normalized, which means they range between [0.0, 1.0]. When you add a vertical offset to UV.y, some values are bound to get outside of this range. For example, adding an offset of 0.5 makes the y coordinates range between [0.5, 1.5].
Sampling at the 1.5 coordinate is effectively asking the GPU to give you the color that's 150% across the texture. That's seemingly impossible, but Godot doesn't crash the shader. Instead, it takes a decision based on the texture's repeat mode.
The repeat mode dictates what happens when sampling a texture outside of its [0.0, 1.0] region. By default, a texture's repeat mode is disabled. In that case Godot clamps the coordinates to the [0.0, 1.0] range. Fragments with coordinates outside it sample as if they were sitting right at the edge of the texture.
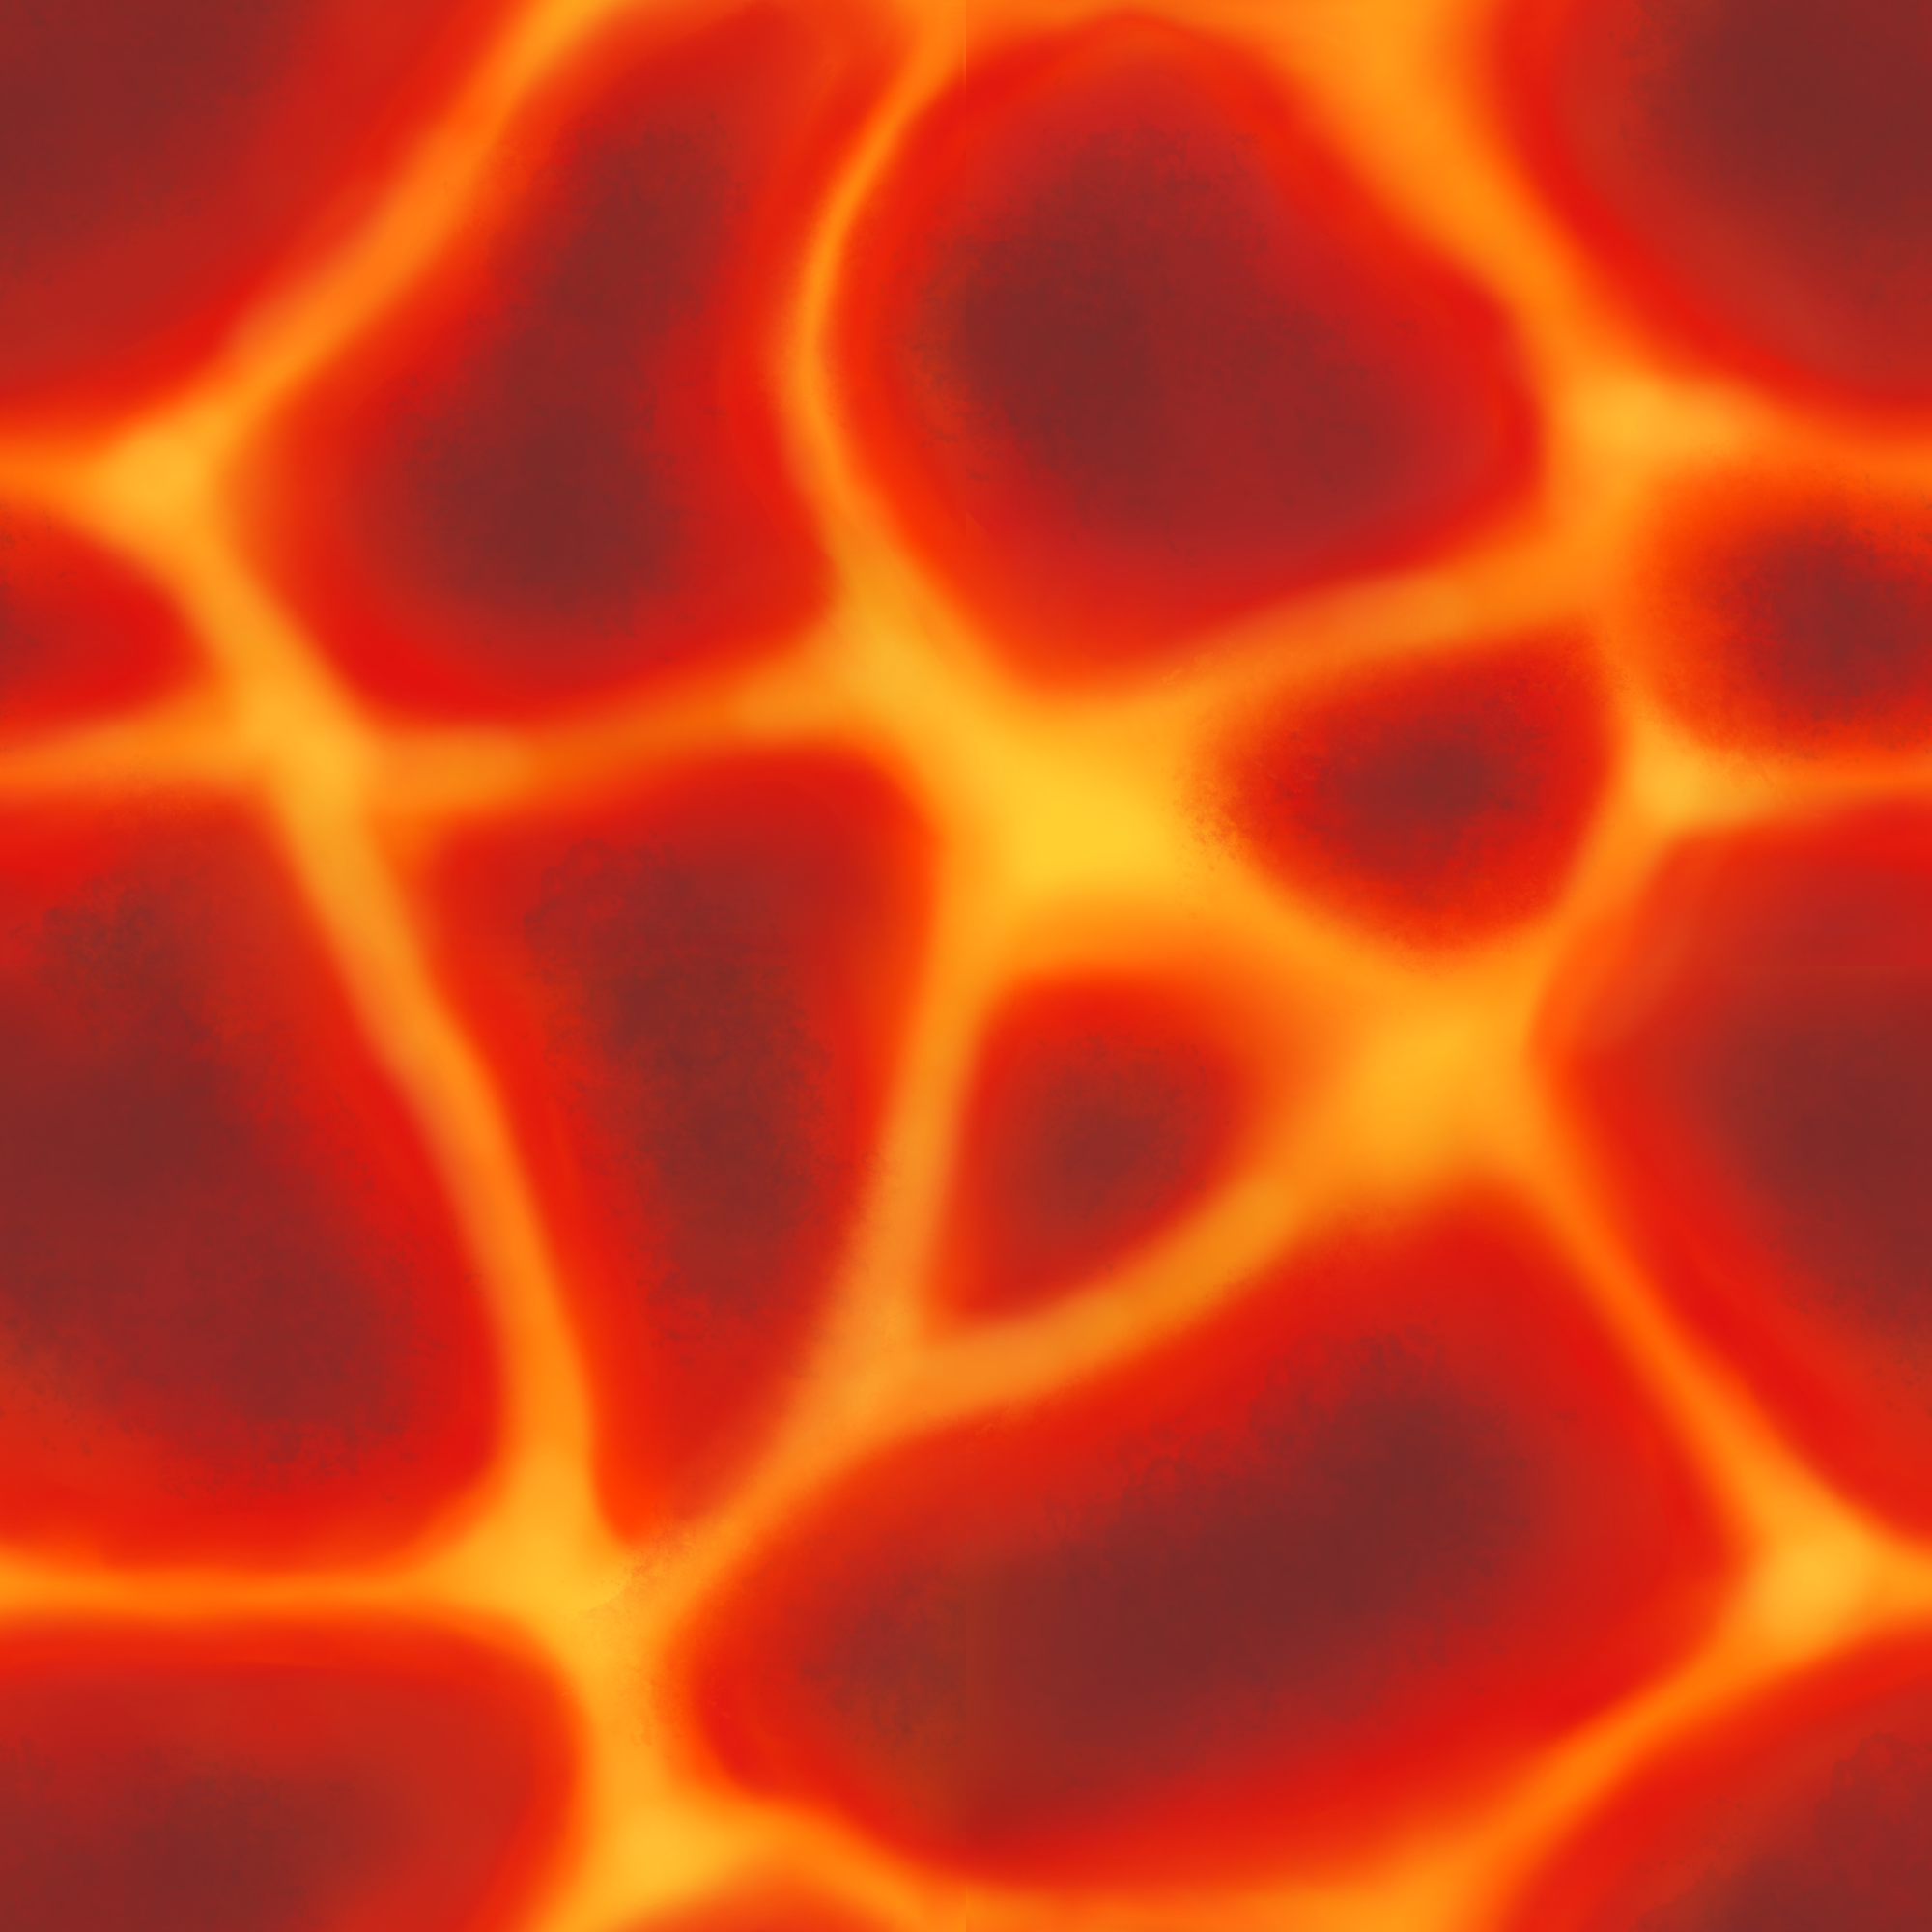
The ghost sprite looks fine because the pixels at the edge are transparent. If you use a texture with opaque edges, you'll get a banding effect. See, for example, what happens with this lava texture when the UVs are shifted down by 0.5:
voidfragment(){vec2 shifted_uv =vec2(UV.x, UV.y +0.5);
COLOR =texture(TEXTURE, shifted_uv);}
To get rid of the lines, discard all pixels for which the coordinates land outside [0.0, 1.0].
Up until now, all sampling positions changed uniformly accross the shader. But that doesn't have to be the case. You can use functions to make fragments behave differently depending on their position. Our ghastly friend would be spookier with a more wobbly shape.
Let's reset the shader so it simply samples the texture.
voidfragment(){
COLOR =texture(TEXTURE, UV);}
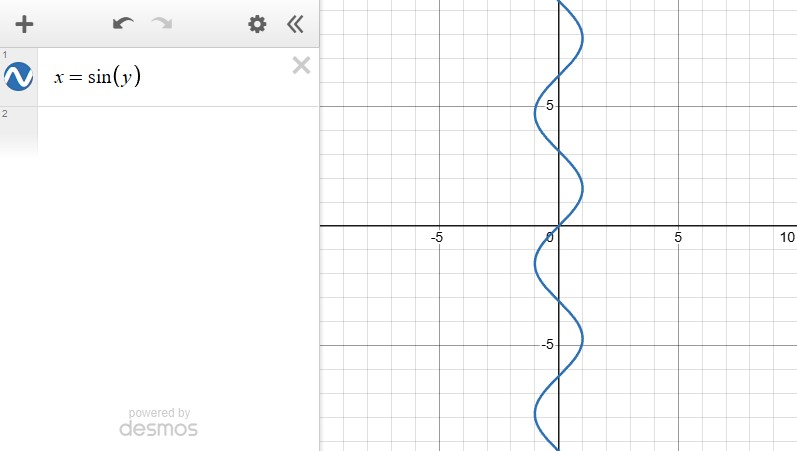
To make a wobble effect, the sampling needs position needs to oscillate left and right as it goes down the texture. You can create oscillation with the already familiar sine function and you get the vertical position by looking at UV.y. The only problem is that, so far, the sine appeared to go from left to right. How can you turn it on its head to make it oscillate from top to bottom?
Up until this moment, most functions were written as .
That's mostly because this is the form we're used to seeing. In Maths class, for theoretical examples, there was seldom a reason to write this differently. is the value you need to find, is the value you have.
In practice, that's not always the case. Take our example: we need to find the position at which we sample based on the vertical coordinate . This means that, this time, the function will have the shape .
The sine oscillates along the axis. That's exactly what we need! Add sin(uv.y) to uv.x to make the sampling points oscillate as they move down the texture.
voidfragment(){vec2 uv = UV;
uv.x +=sin(uv.y);
COLOR =texture(TEXTURE, uv);}
It might look weird right now, but it's just the classic issue again: The wave isn't yet adjusted to give a softer, more frequent oscillation.
The good news is that scaling and translating work exactly the same way. The and parameters adjust the function horizontally, while and adjust it vertically:
Why does this still work?
Changing the orientation of a function doesn't change the axes on which it's drawn. still represents a vertical coordinate and a horizontal one.
The technical details don't matter much in this case, but with some juggling, can be turned into , with being the inverse of the sin function. This leads to a formula with the same shape as our previous ones. You just have to flip the equality terms:
Pick , , and and you get , which leads to x being:
Let's add that value to the horizontal sampling points of our shader:
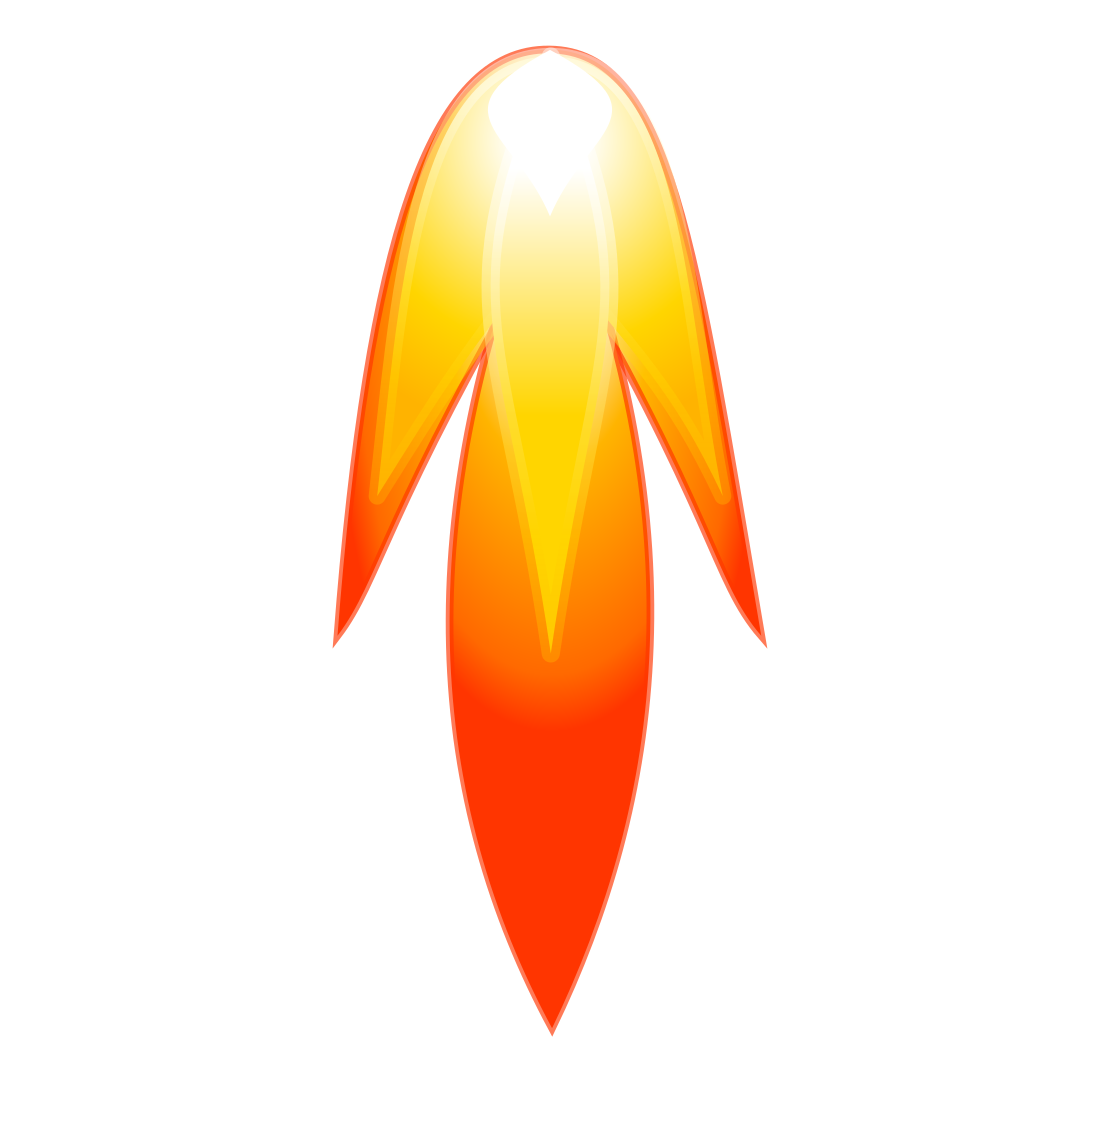
Bending and morphing textures can be extremely helpful in making animations that would be hard or even impossible to create. Take for example this thruster fire. It looks nice when the ship flies straight:
Woosh!
But as you turn the ship, its lack of inertia makes it feel stiff.
The pilot fell asleep on the right thruster lever again..
You can simulate inertia by bending the flame as the ship turns. The flame curves more as it approaches its tail.
You need a function that takes the current coordinate as an input and outputs a horizontal displacement to shift the sampling point.
To achieve this, the function has to meet two requirements:
Anchor the base: At the top of the flame (where ), there should be no bending ()
Curve the tail: As we move down the texture and increases, the horizontal displacement must grow progressively faster.
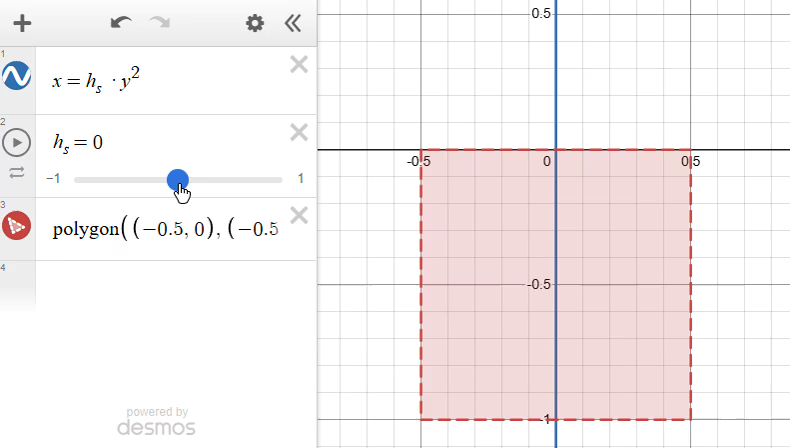
A simple parabola starting at the origin perfectly fits this behavior:
To adjust the shape of this curve all you need to do is to change its horizontal scale. The final control formula ends up being , which makes x:
Why does the shader move in the opposite direction?
It might feel strange to increase uv.x and to see the flame bend to the left. This is because you're not moving the image, you're moving the point at which the image is sampled.
With a positive offset you're telling the fragment to sample a texel that lies more towards the right. This leads to the flame looking like its being pushed left.
Notice that the only thing that changed is the function itself. And what a big difference that made!
You started this guide with functions made out of seemingly magic numbers. Now, you have a systematic way to look at any visual effect and control it in your shaders.
OldDew
Teacher at GDQuest
Did I forget my keys? Oh! They're in my pocket.
How can someone remember all of this!
You don't need to! It's not important that you remember all of the formulas. What matters is that you start piecing together how shaders work.
You can always refer back to this article when you need to; and you can look up online how to draw different types of curves and parabolas. You can also read shader code written by others; even shaders made for other frameworks and engines than Godot; you'll find many of the concepts are similar.
By practicing writing and reading shaders, you will slowly build up the memory and intuition you need.
Become an Indie Gamedev with GDQuest!in GDSchool
Don't stop here. Step-by-step tutorials are fun but they only take you so far.
Try one of our proven study programs to become an independent Gamedev truly capable of realizing the games you’ve always wanted to make.